From Data to Dashboards: Using Excel to support health program decisions
June 6 to July 15, 2022 (6 weeks, expect roughly 5 hours per week)
– Self-paced lectures
– Assignments and quizzes
– Weekly 1 hour live session office hours (optional)
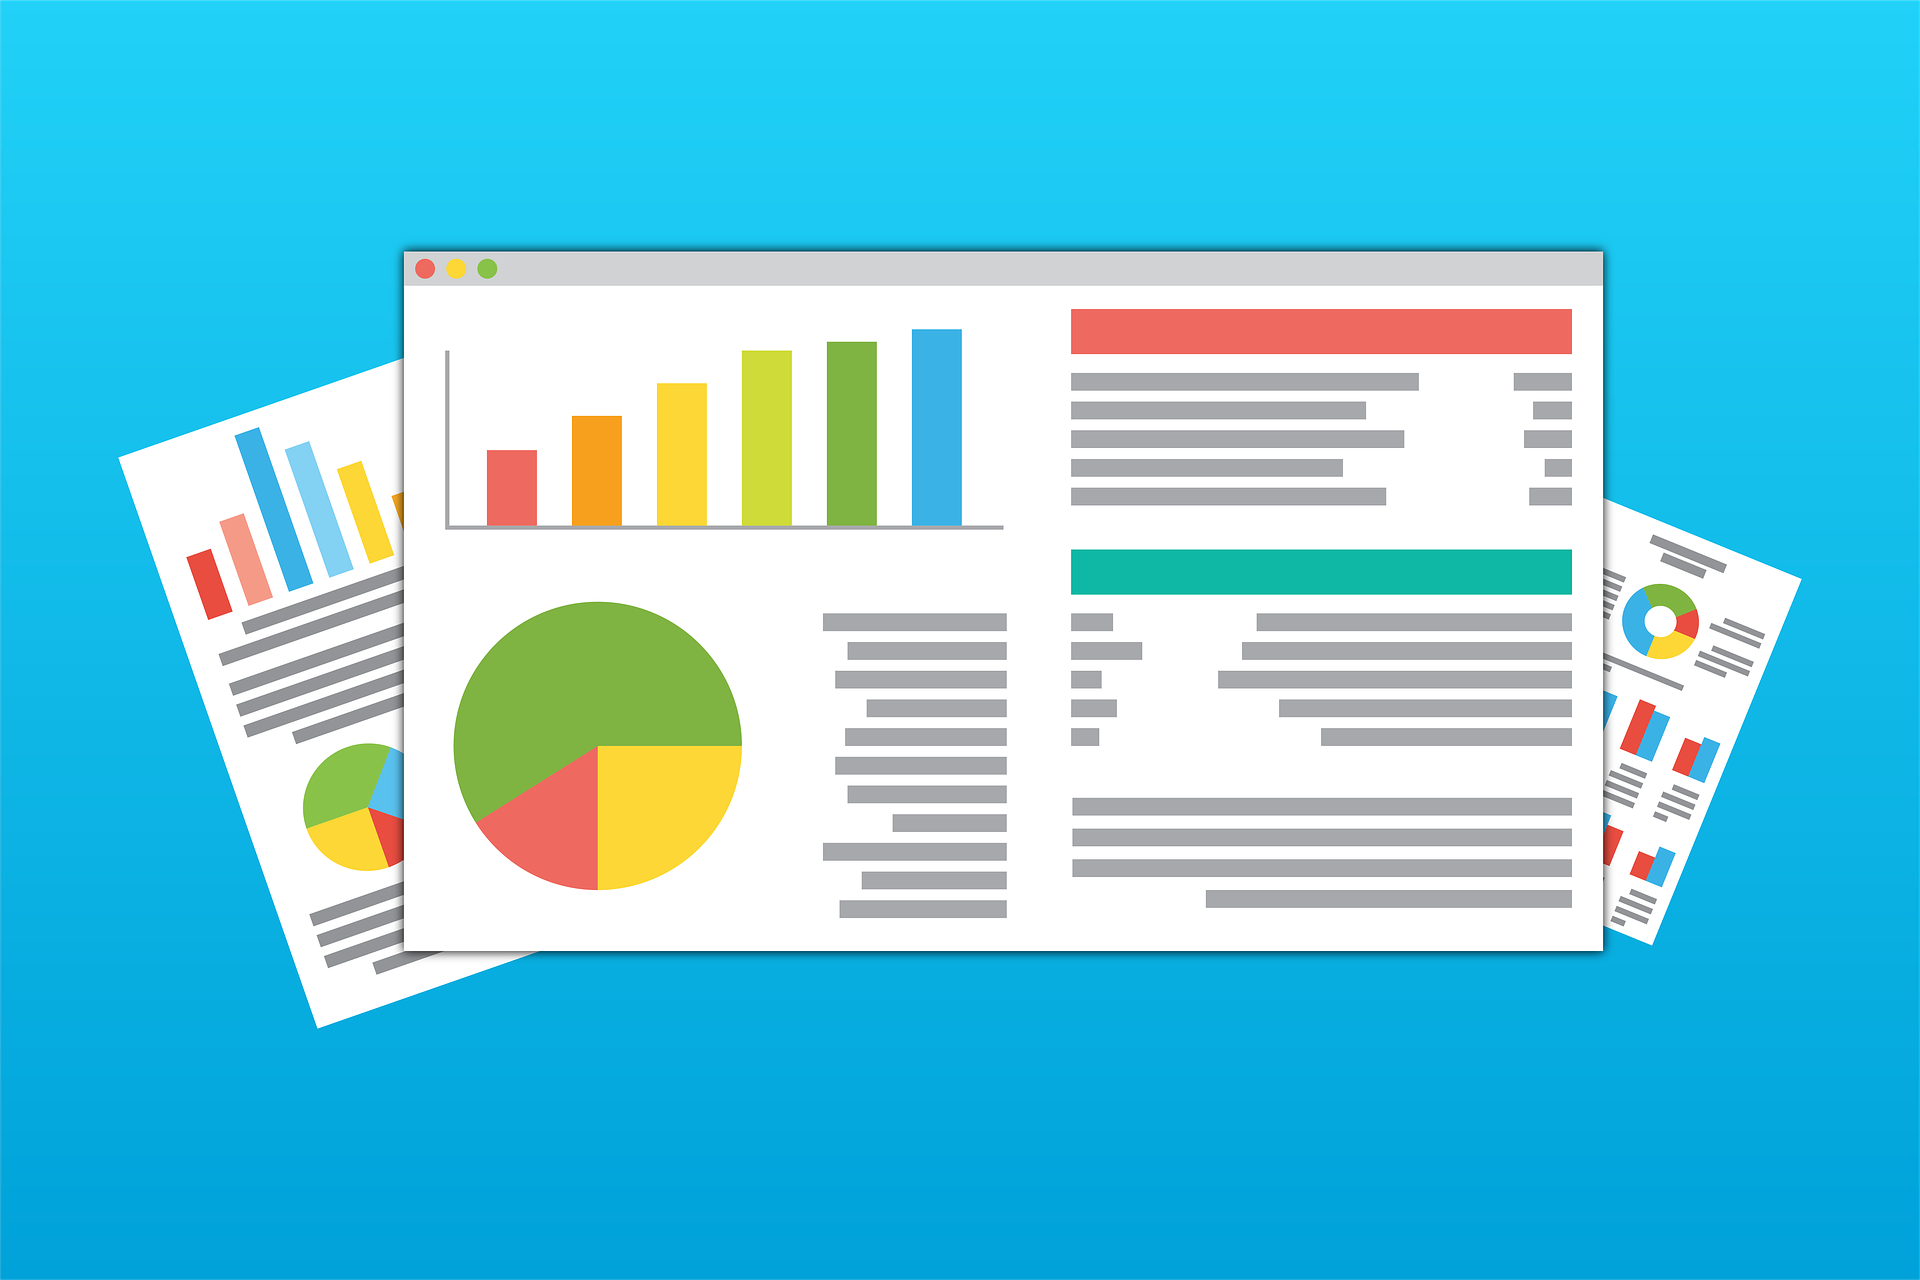
More than ever before, managers need to make sound decisions based on data. Robust dashboards are important tools in this process. In this course, participants will learn and apply useful formulas, graphing and dashboarding techniques, and data analysis in a wide range of real-world case study examples, such as hospital admissions, enrollment and utilization analysis, and performance dashboards to monitor and evaluate health interventions. Students will have the opportunity to build their own dashboards.
Through self-paced lectures, readings, and individual hands-on practice, participants will complete the course modules as they develop Excel skills, learn which types of graphs are best for displaying various categories of data, and combine these elements into a final project dashboard.
PHX provides a 25 percent discount to students, SPH alumni, and BU faculty and staff. We will also offer a 25 percent discount for any resident of upper-middle-income countries, lower-middle-income countries and low-income countries (“LMIC” based on the World Bank Classification).
Individuals registering for more than one paid program at full price will receive a 15 percent discount (use coupon “2ormore”). A 15 percent discount is also offered to organizations sending three or more paid program participants (Contact us at phx@bu.edu for more information).
(Please note discounts cannot be combined)

